 OurBrewbot
Dashboard
The Dashboard is the first page of the admin page. It shows how the controller is doing, and a card for each of the four fermenters.
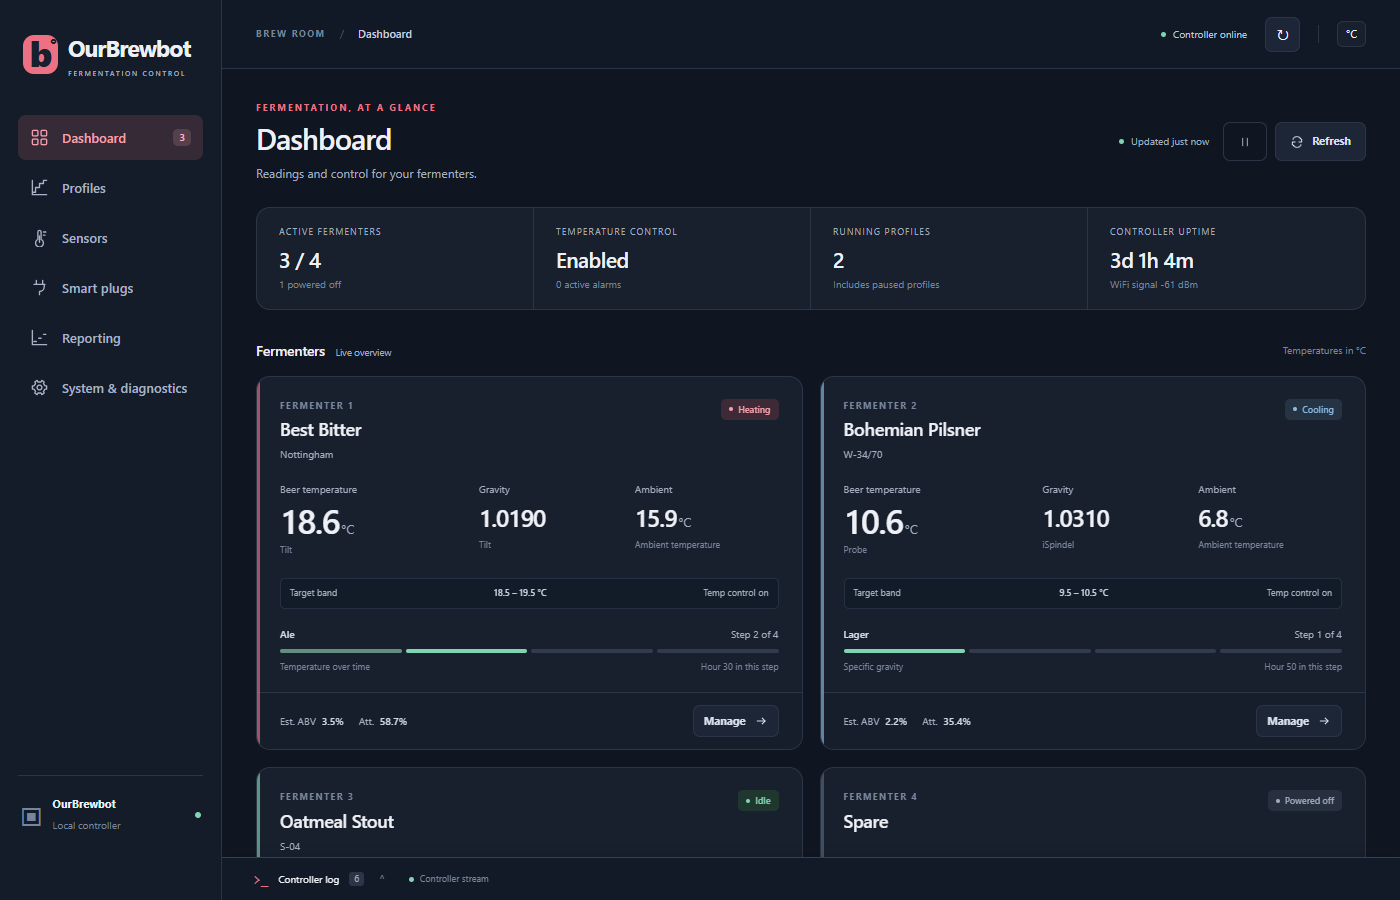
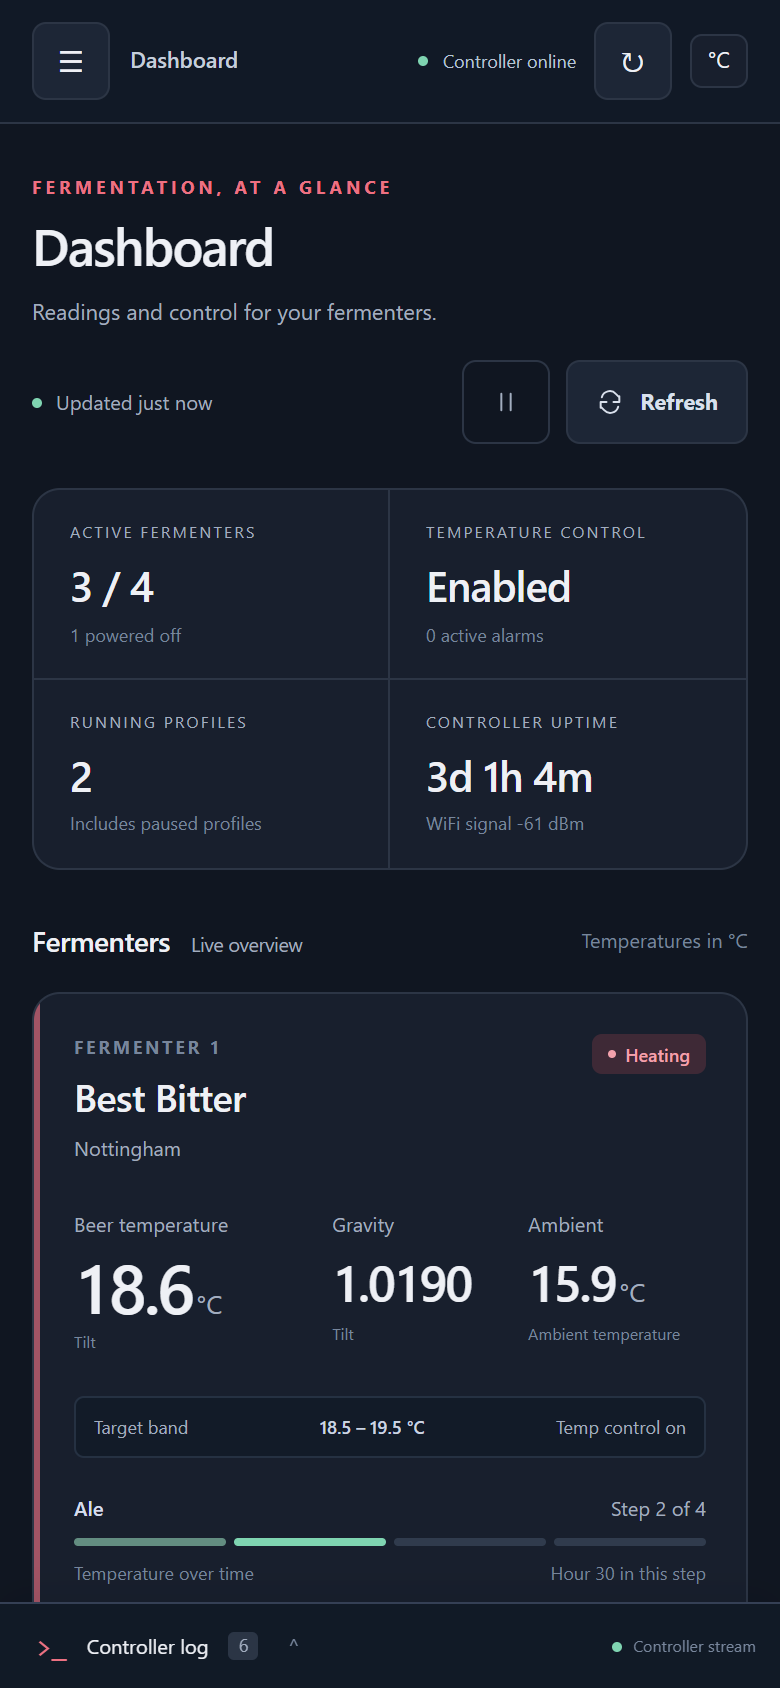
The readings refresh by themselves every 10 seconds. Updated just now says how old they are. The ⏸ button pauses the refreshing and Refresh reads everything again straight away.
Summary tiles#
| Tile | What it shows |
|---|---|
| Active fermenters | How many fermenters are switched on |
| Temperature control | Enabled while any fermenter is controlling its temperature, Check alarms if any fermenter has an alarm, with the number of alarms underneath |
| Running profiles | How many fermenters are running a profile, including paused ones |
| Controller uptime | How long the controller has been running, and its WiFi signal strength |
Fermenter cards#
Each card shows the fermenter's name, the beer and the yeast, and a badge saying what it's doing: Heating, Cooling, Idle or Powered off. If the temperature has gone outside its limits, the badge says Alarm as well. The strip down the card's left edge is coloured to match.
Under each reading is where it comes from:
- Beer temperature comes from the fermenter's Tilt, then its beer probe, then its iSpindel, whichever is first to have a reading. If none of them has one, the fermenter is controlled from its ambient probe and the card says Ambient. See Temperature probes.
- Gravity comes from the fermenter's Tilt, then an iSpindel that's still reporting. With neither, it's an Estimate worked out from the original and target gravity and how long the profile has been running.
- Ambient is the air temperature from the fermenter's ambient probe.
Target band is the range the fermenter is kept within, from its floor to its ceiling, and whether temperature control is on.
If the fermenter has a profile, the card shows its name, which step it's on and how many hours it has been on that step, with a bar for each step. Otherwise it says Standard temperature control, which holds the fermenter at the band you set.
At the bottom, Est. ABV and Att. (attenuation) are worked out from the original gravity and the current gravity. Manage opens the fermenter's settings.